Chart Types
There are six kinds of charts:
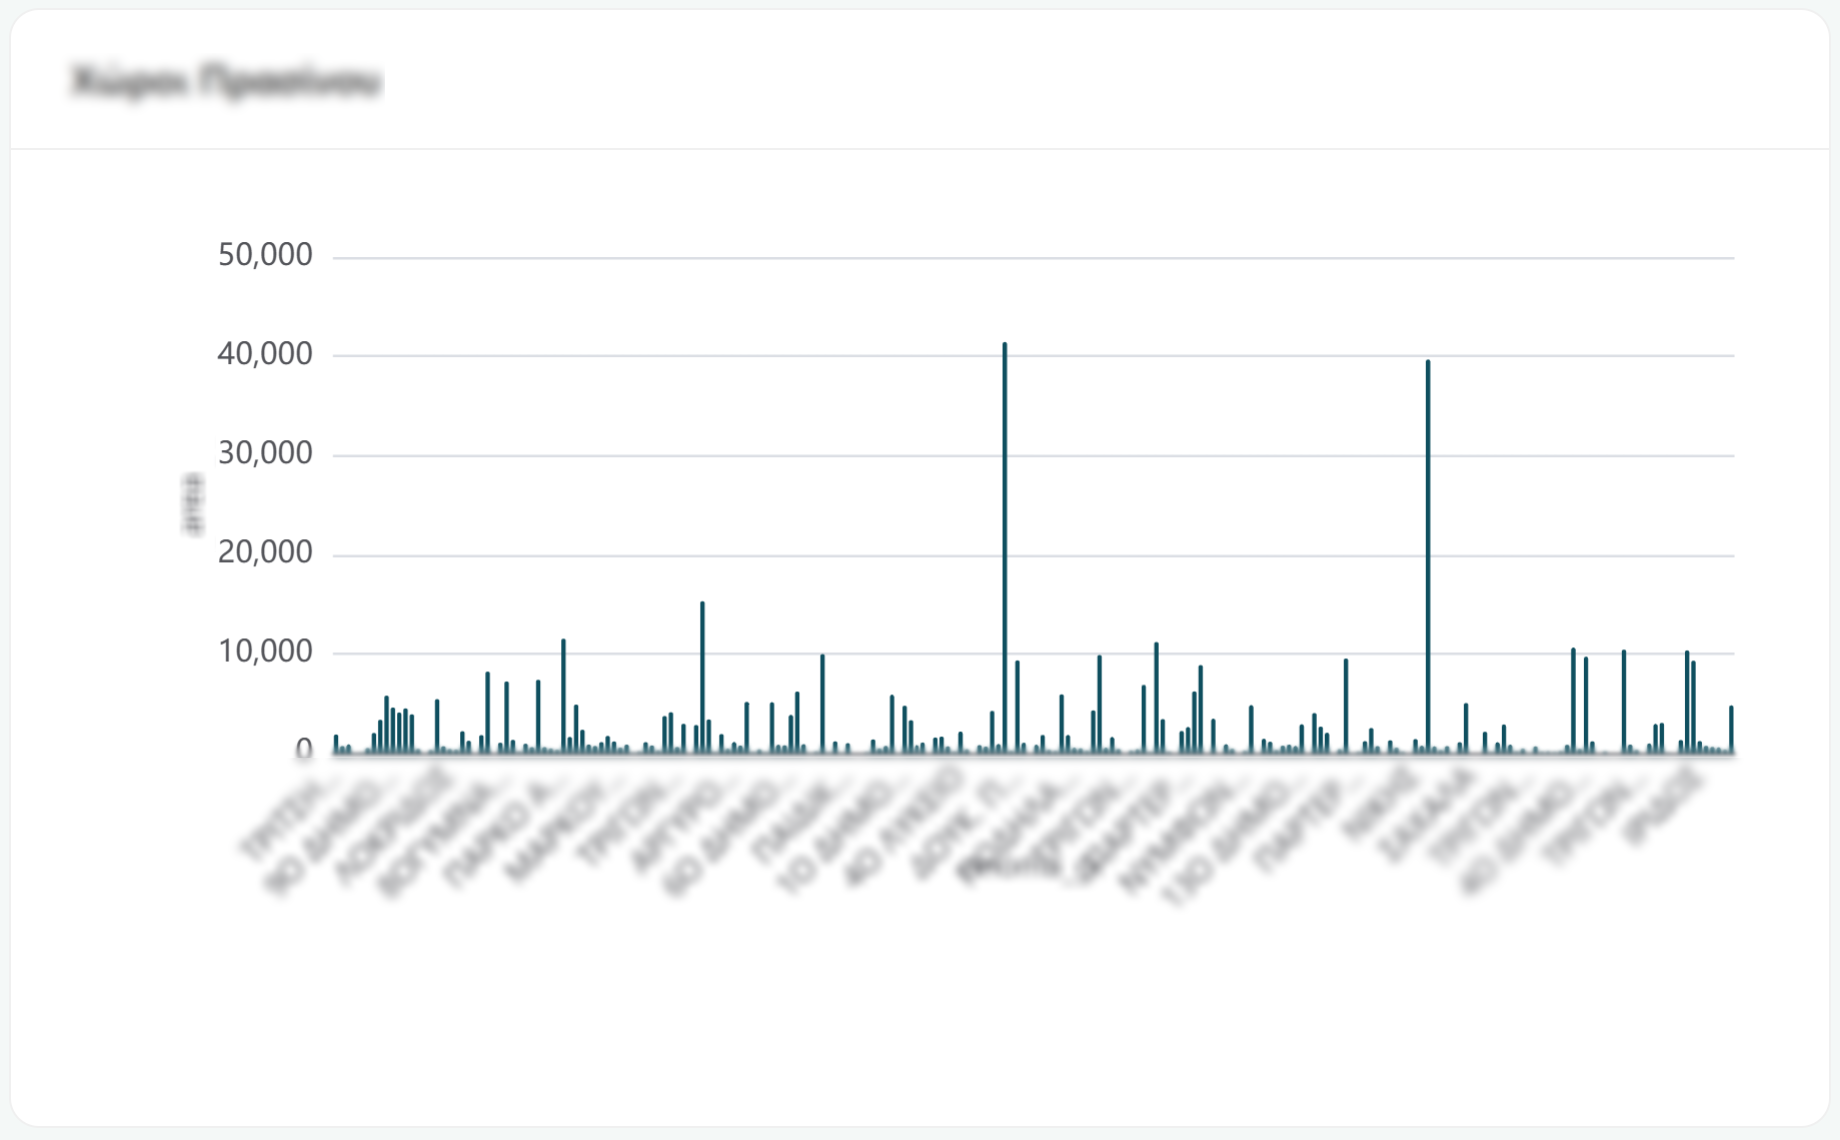
Bar chart
Compares one thing across categories (population by district, cases by type, spend by department, etc). Hover over any bar to see its exact value in a tooltip.
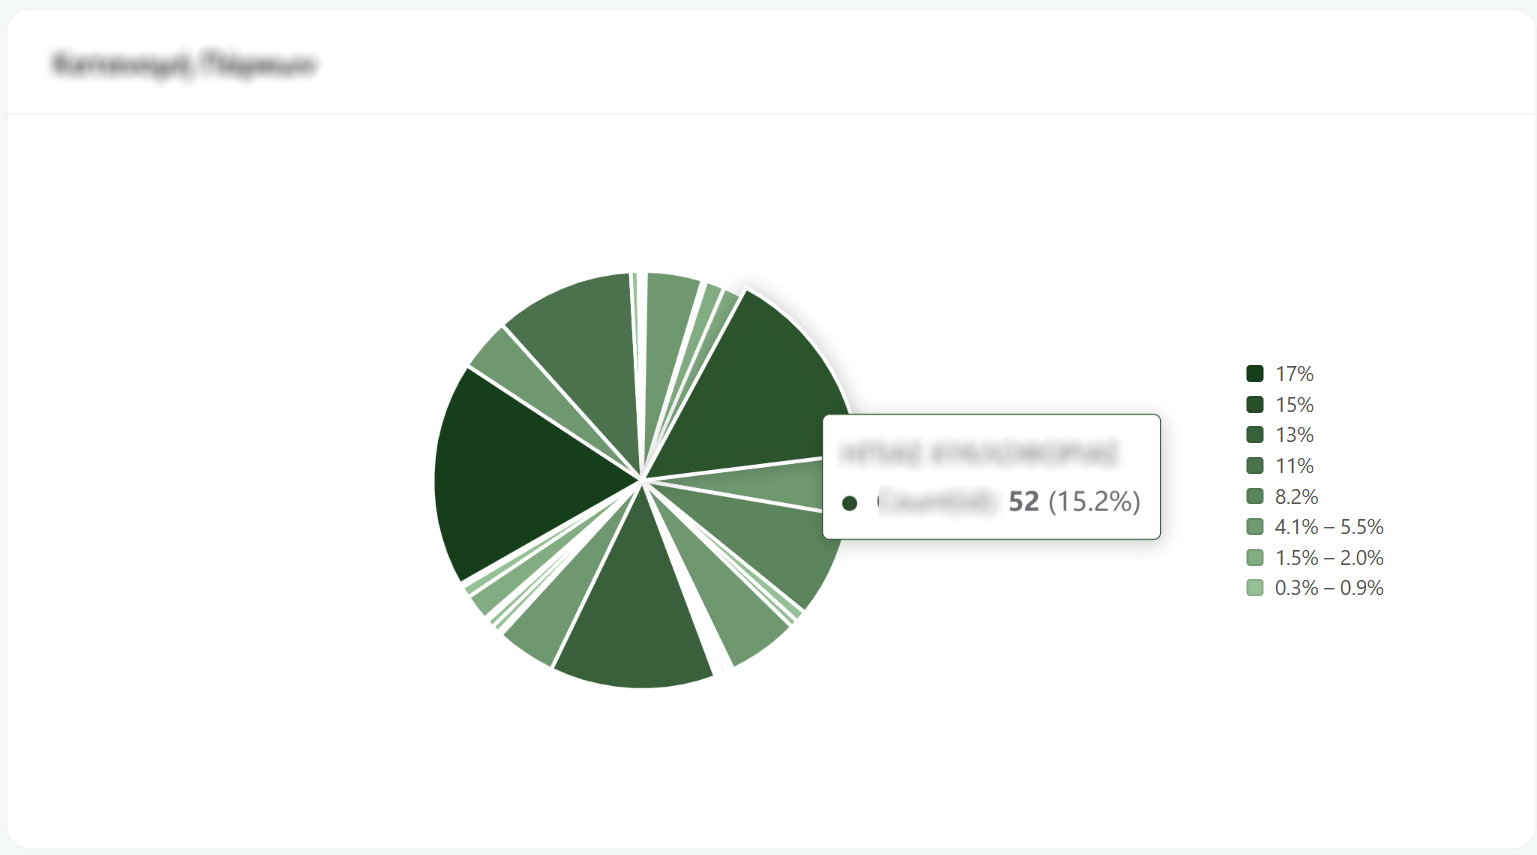
Pie chart
Shows how a whole splits into parts (what share of the total each category takes). Hover over a slice and you'll get the category name, its actual value, and its percentage of the total. The list beside the chart is the legend.
Table
The actual records, one per row. This is where you go when the summary isn't enough and you need the detail.
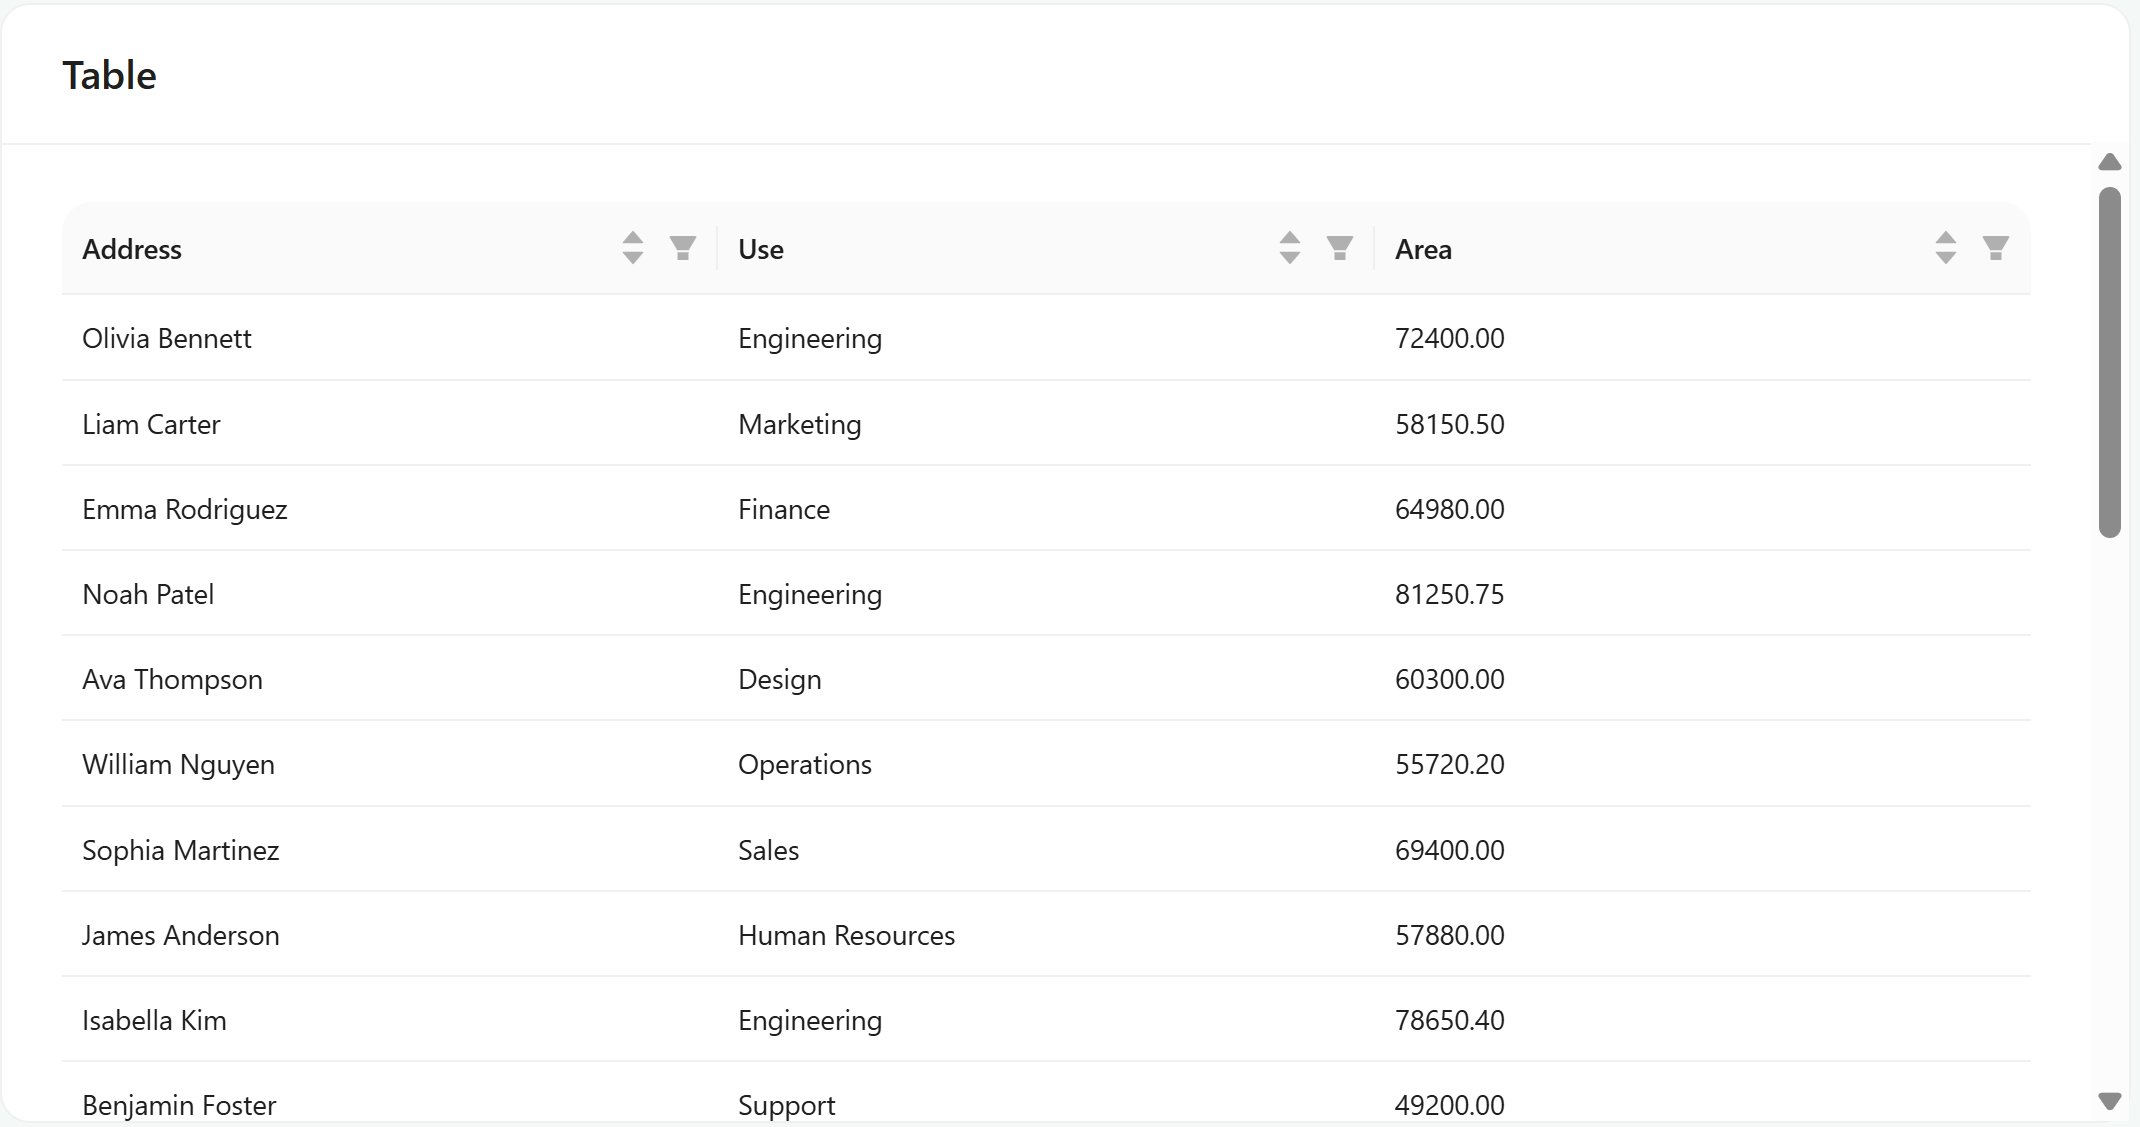
It's more interactive than it looks:
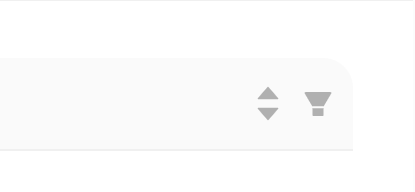
Sort: click a column heading. Click again to reverse it.
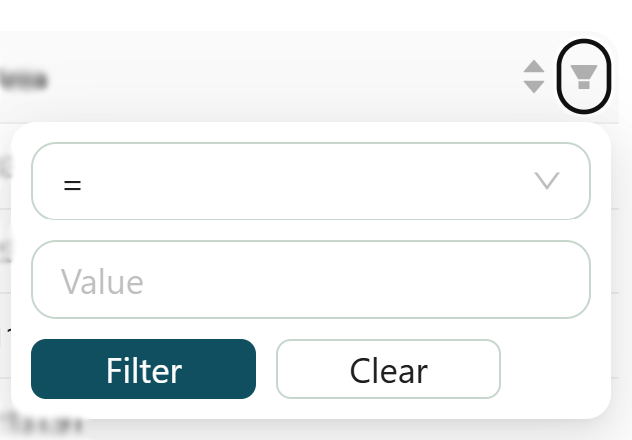
Filter: click the little filter icon in a column heading. A small form opens, and it adapts to the kind of column. Number columns let you set conditions like greater than, less than, equals, or between two values and Text columns let you match on equals, contains, starts with, or ends with.
Counter
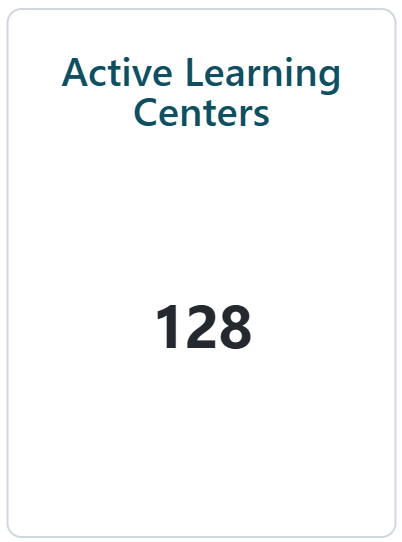
A single block showing information about a category. Count, Average, Maximum, Minimum etc.
Map
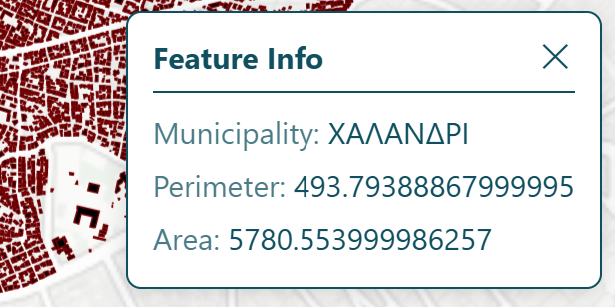
A map of one data layer, already zoomed to the area the author wanted you to see.
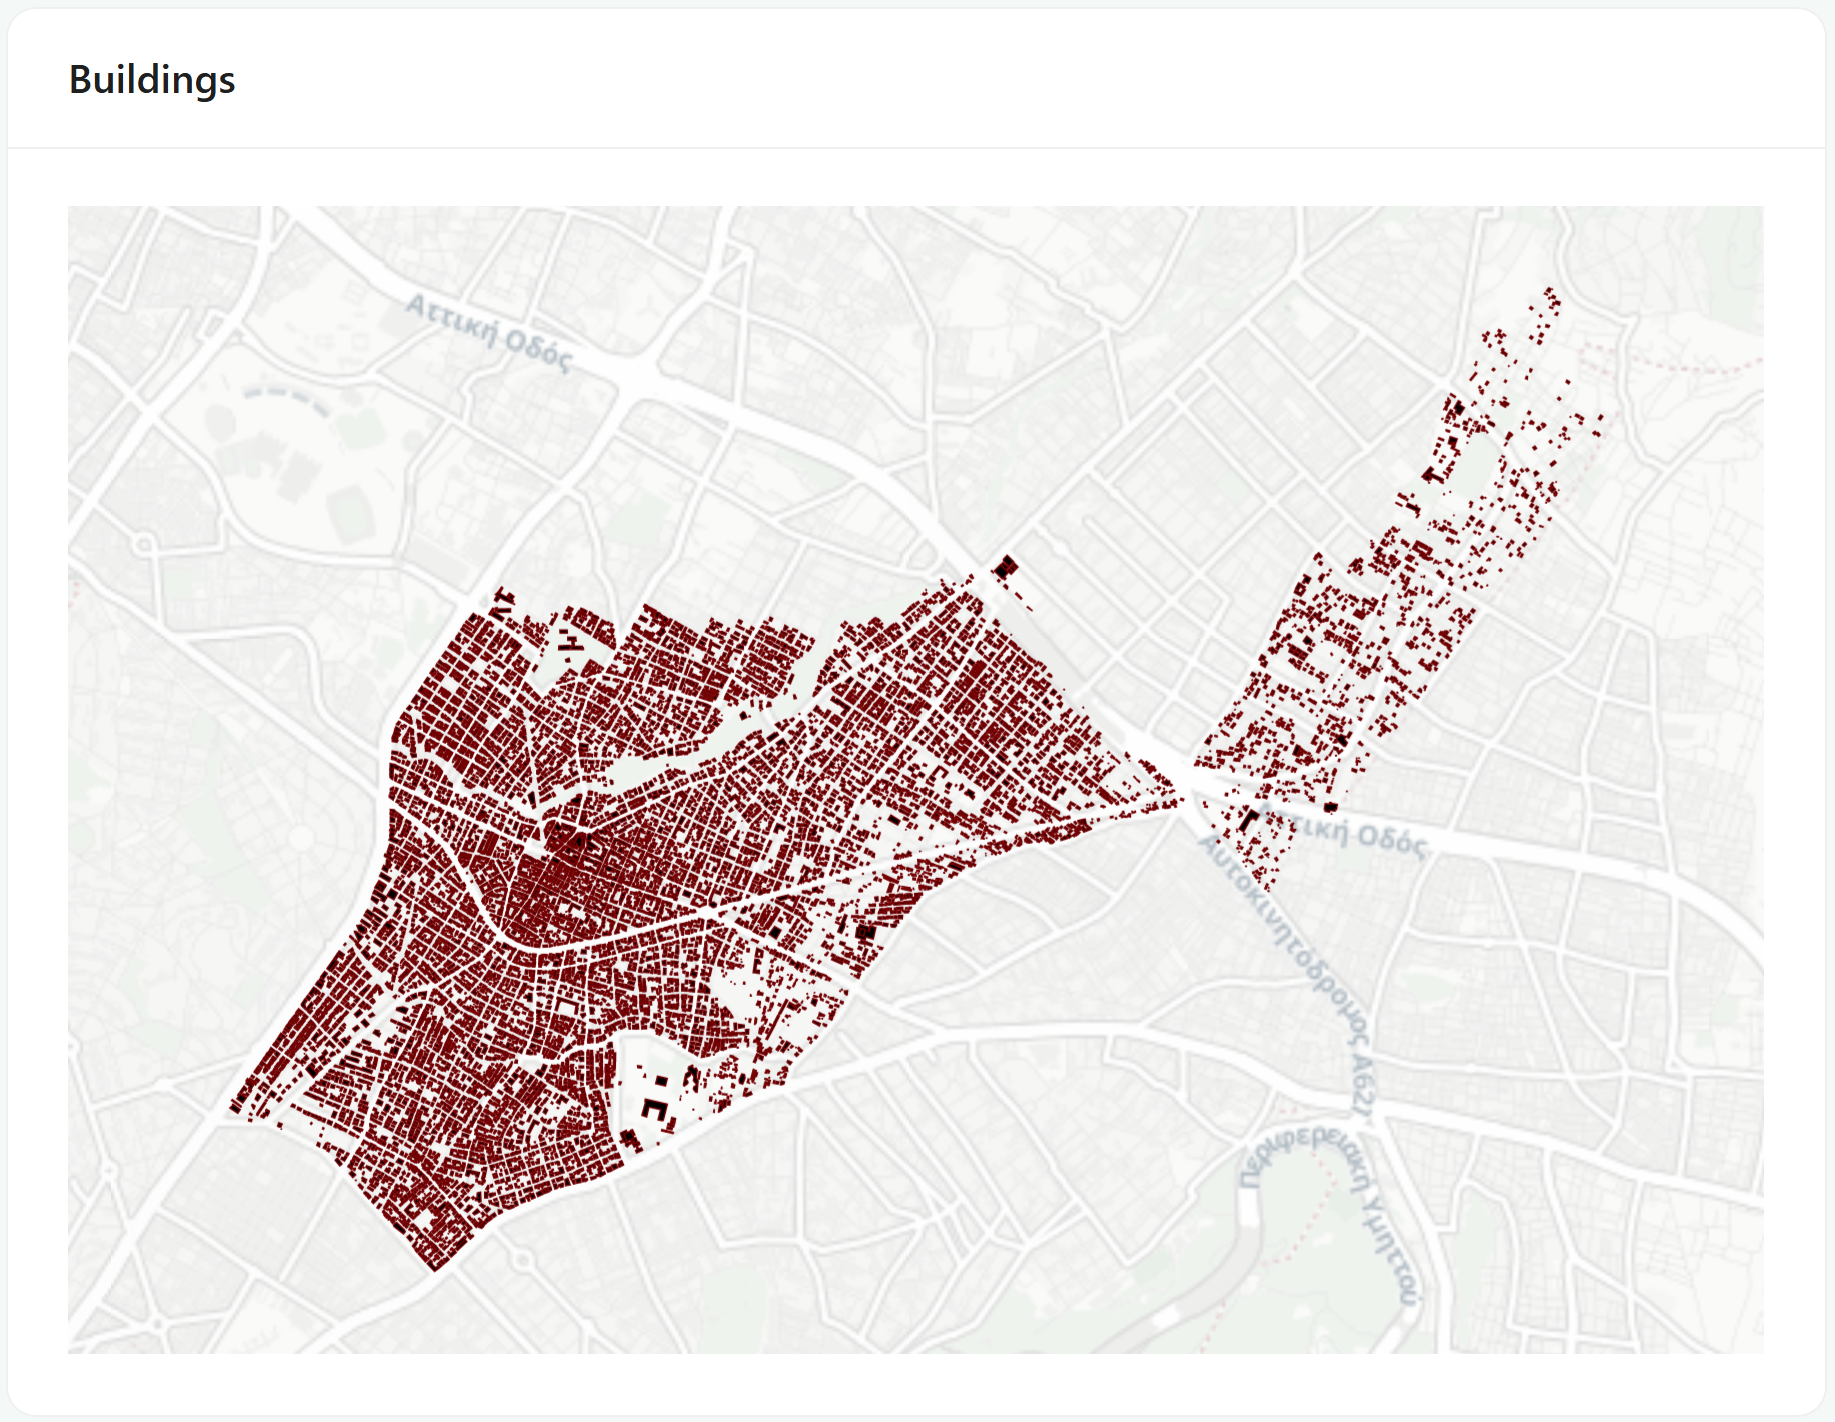
When you click, a small Feature Info box opens with an ✕ to close it, which shows information about the clicked feature's details.
Text
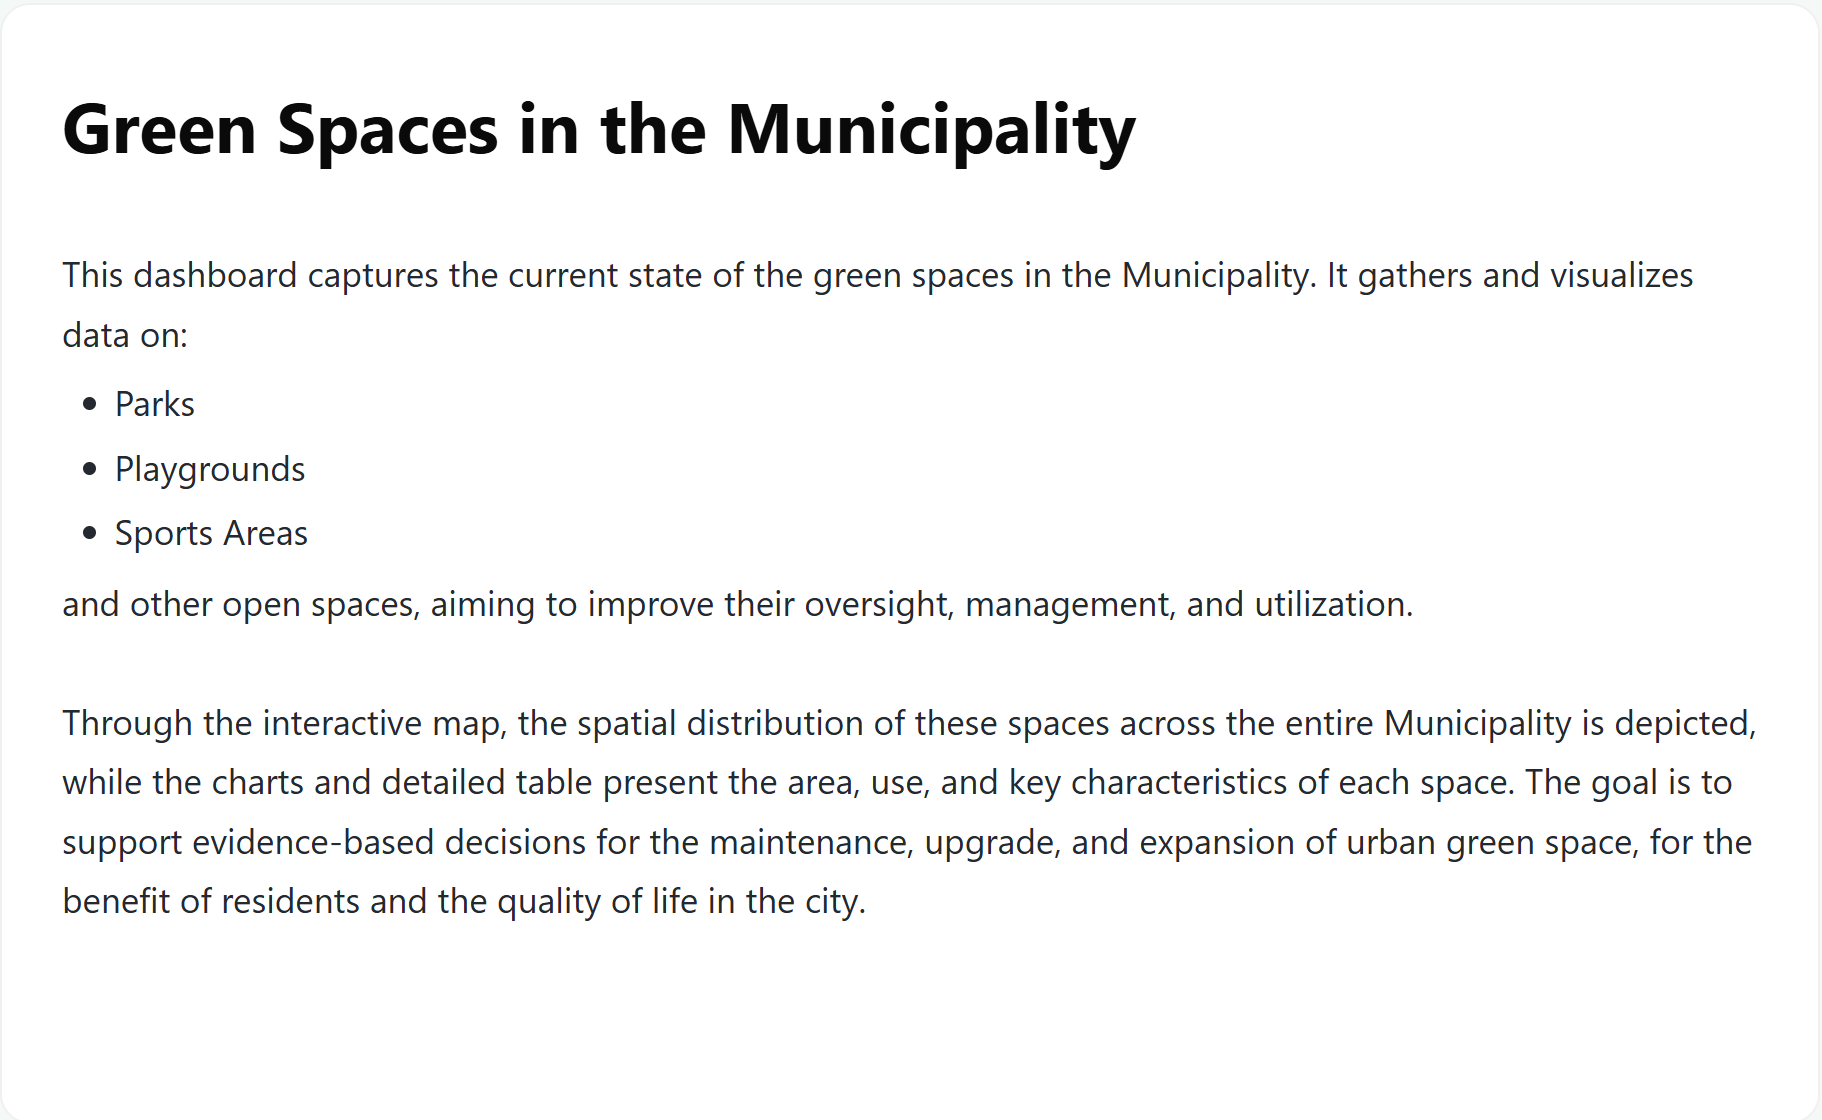
A formatted note from the dashboard's author - an explanation, a caveat, a definition of terms, or instructions. Worth reading before you interpret the numbers, since this is usually where the "what this actually measures" detail lives.