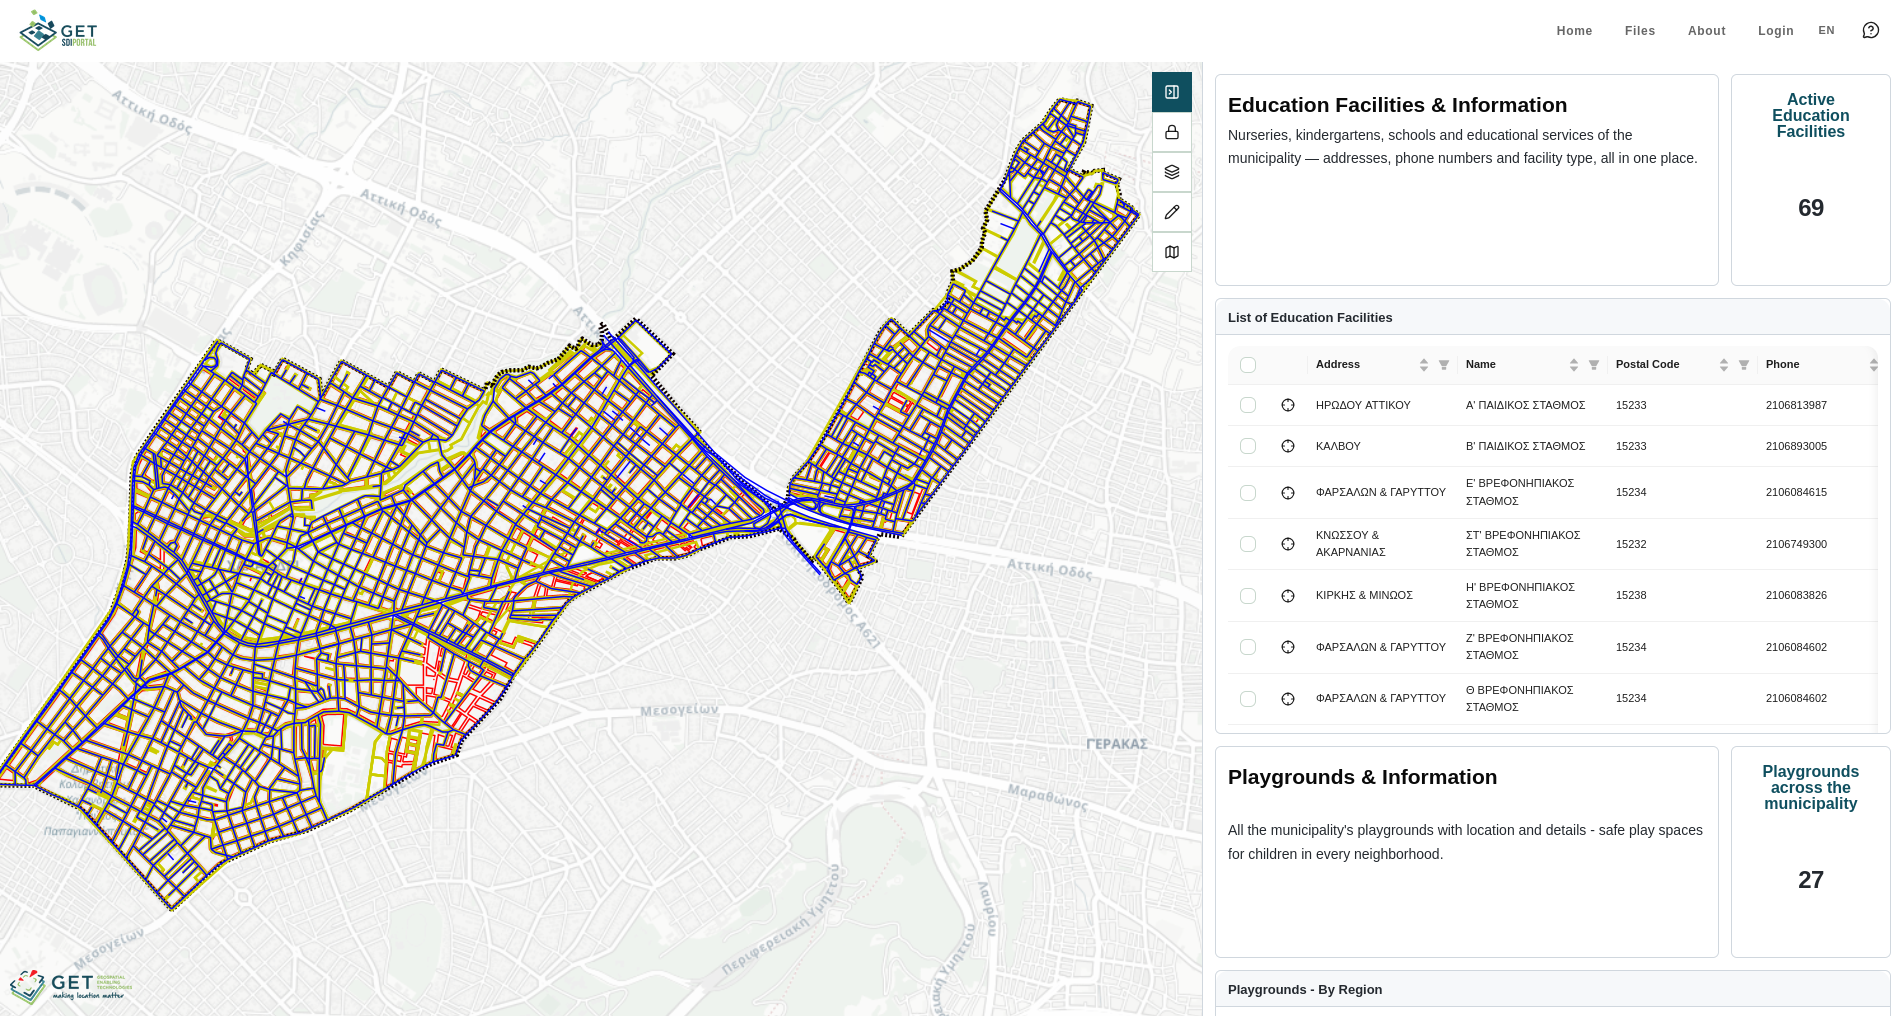
The Map Dashboard
What makes it different
On a map dashboard, the map isn't just another card, the charts in the side panel are wired to it.
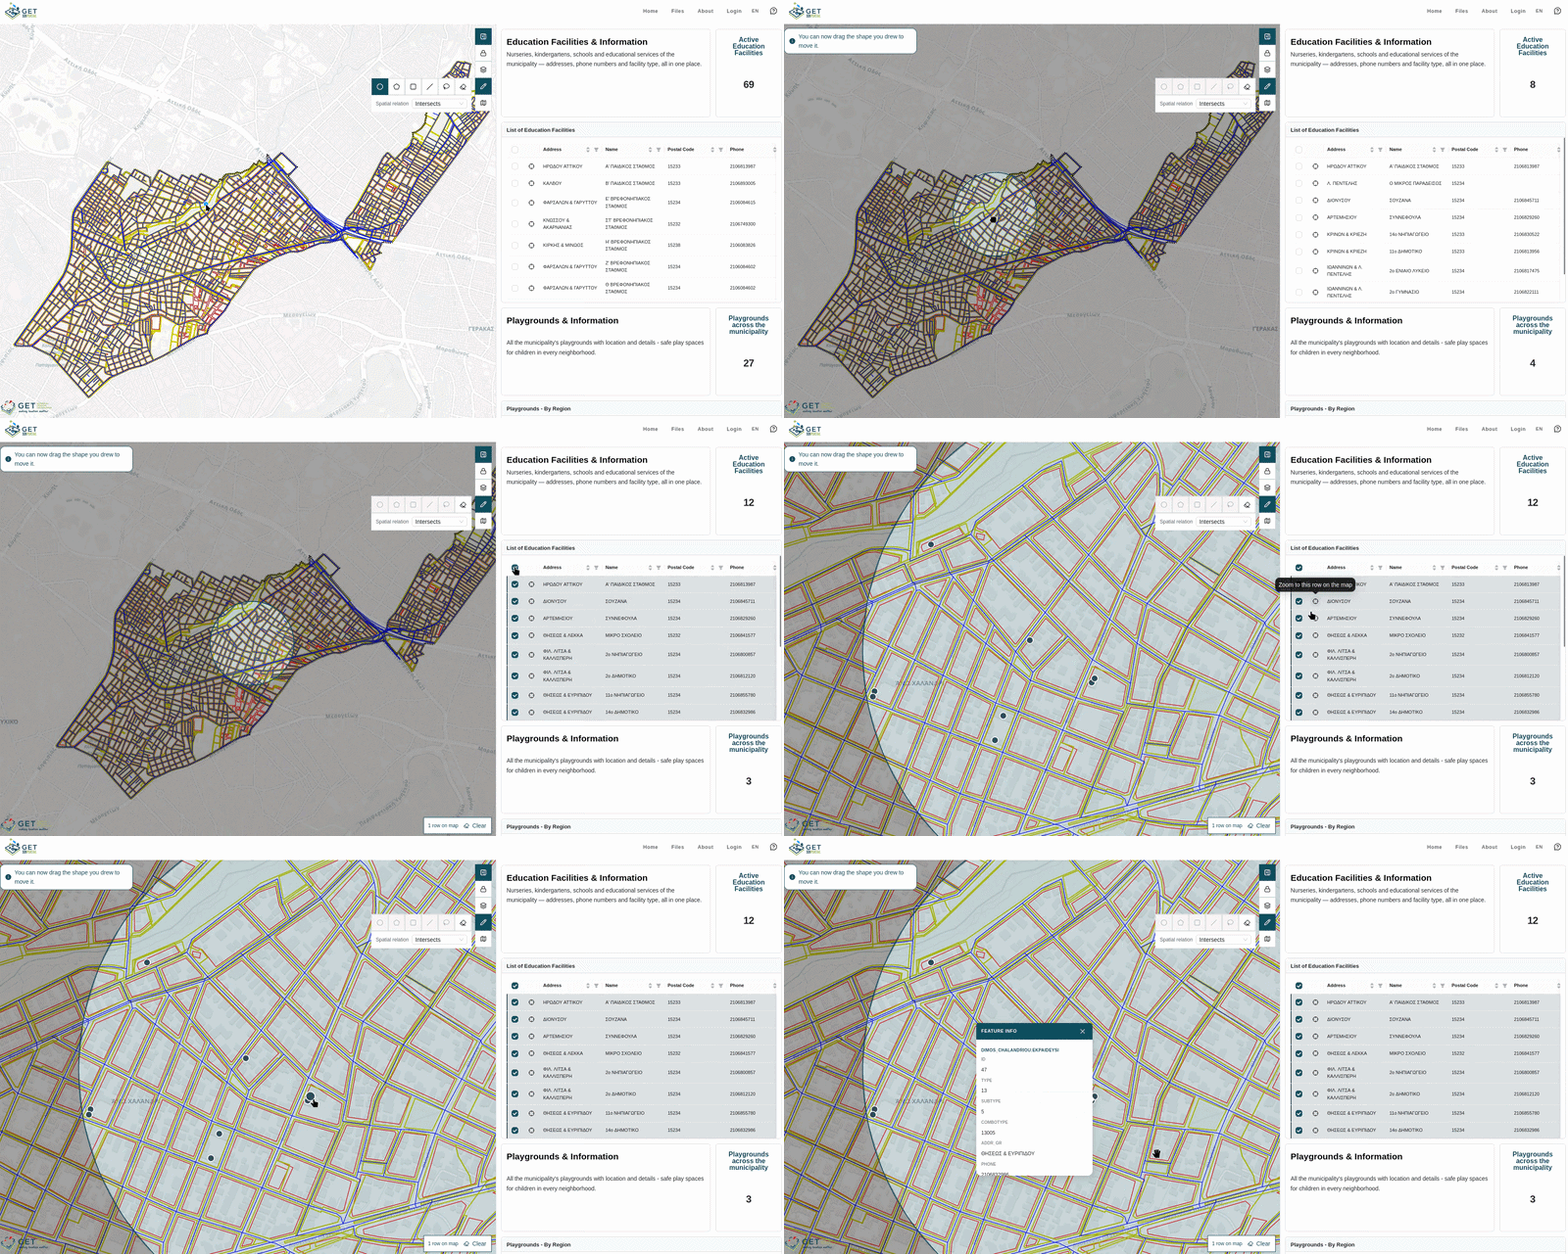
Draw a shape on the map, and every chart, number and table instantly recalculates using the records inside that shape.
That's the whole idea: instead of reading fixed totals, you get to ask "what about this area?" and see the answer immediately.
Moving around the map
Drag to pan. Double-click or pinch to zoom. By default the scroll wheel won't zoom the map, to enable it click the padlock button in the toolbar to unlock it.
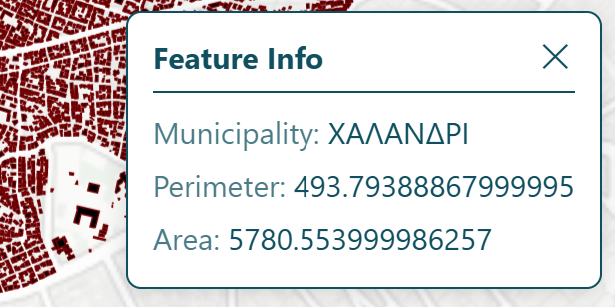
Click anywhere on the map to ask what's there. A Feature Info popup opens listing the details of whatever you clicked.
The toolbar buttons
| Button | What it does |
|---|---|
 |
Collapse Panel: Hides the chart panel so the map gets the full screen, or brings it back. |
 |
Scroll Lock: Turns mouse-wheel zoom on or off. Closed = off (the default). |
 |
Layers Overview: A tick-list of the map's data layers. Untick to hide one, tick to bring it back. |
 |
Draw: Opens the drawing tools, this is the area-filter feature. |
 |
Basemap Switch: Switches the background map. |
The Drawing Tool
Click Draw and you get four ways to mark an area:
| Tool | How to use it |
|---|---|
| Circle | Click for the centre, drag out, click again to finish. |
| Polygon | Click each corner, double-click the last one to close it. |
| Square | Click and drag from one corner to the opposite one. |
| Lasso | Hold the mouse down and draw freehand. |
| Eraser | Removes the shape and puts every chart back to its full totals. |
What happens the moment you finish drawing
By default the side panel shows data based on the whole map.
After you select an area with a shape, every chart in the side panel reloads: the numbers, the bar and pie charts, and the table all recalculate against the records your shape touches. You'll see a brief loading state on each card while this happens.
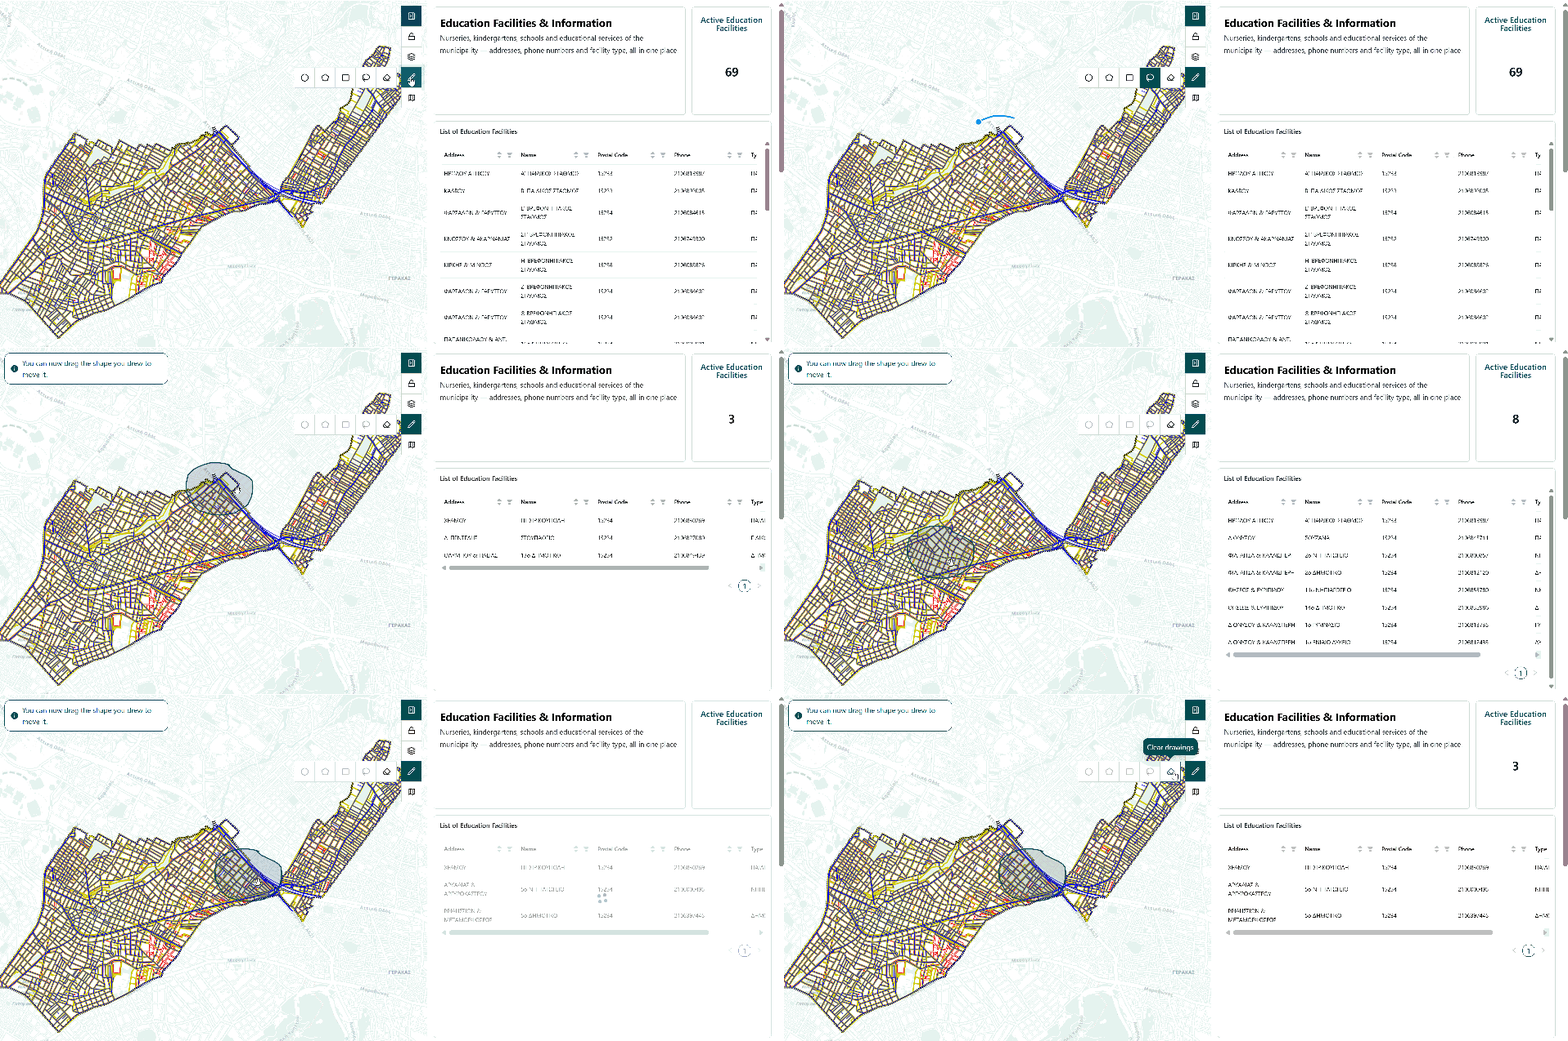
After drawing a shape, you can move its position by dragging it with the mouse cursor.
If you want to remove the shape drawn, use the Eraser to clear the shape from the map. This action will reset the data in charts to the default state.
Charts and the Map Work Together
The drawing tool is one direction, draw on the map and the charts update. But it works the other way too: interact with a chart and the map responds.
Click a row in a table chart, and the map places a marker at that feature's location, or use the row's pan action to fly straight to it. Click a slice in a pie chart, and every feature in that category lights up on the map with markers. The interaction works across chart types: wherever a chart element corresponds to features on the map, clicking it will show you where those features are.
Note
Chart-to-map interactions are visual, they highlight features on the map but don't filter the other charts the way drawing a shape does.
The Layers Tool
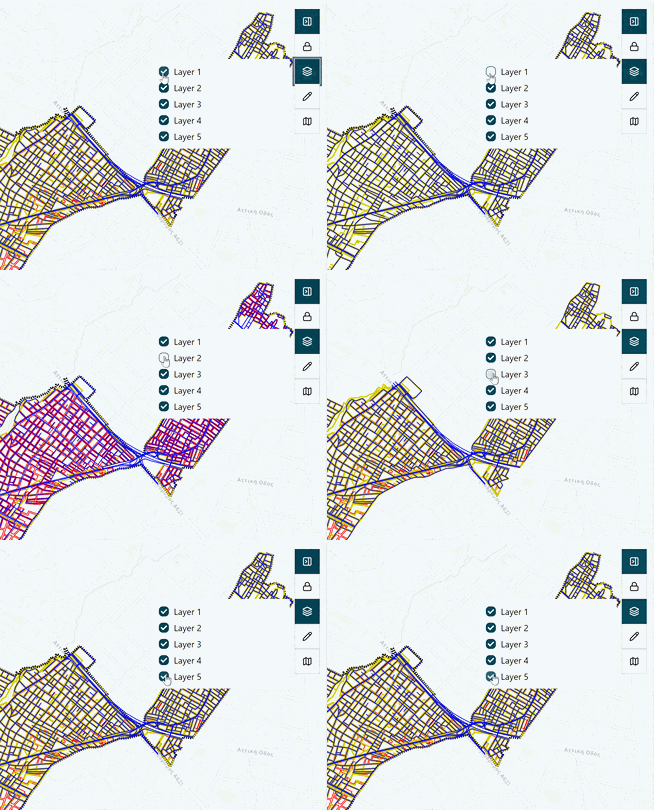
The layers tool allows you to enable and disable which layers are visible on the map.
Enabling/Disabling Layers
This option doesn't change the way data are calculated or shown. Enabling/disabling layers is only a visual option, separate from the shape drawing and calculation methods.
Basemap Change Tool
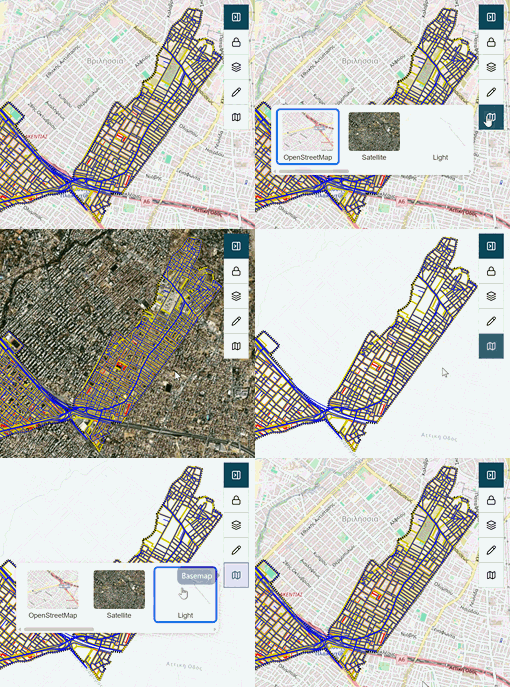
The basemap button changes the visual of the map to a choice of many available basemaps.