The Standard Dashboard
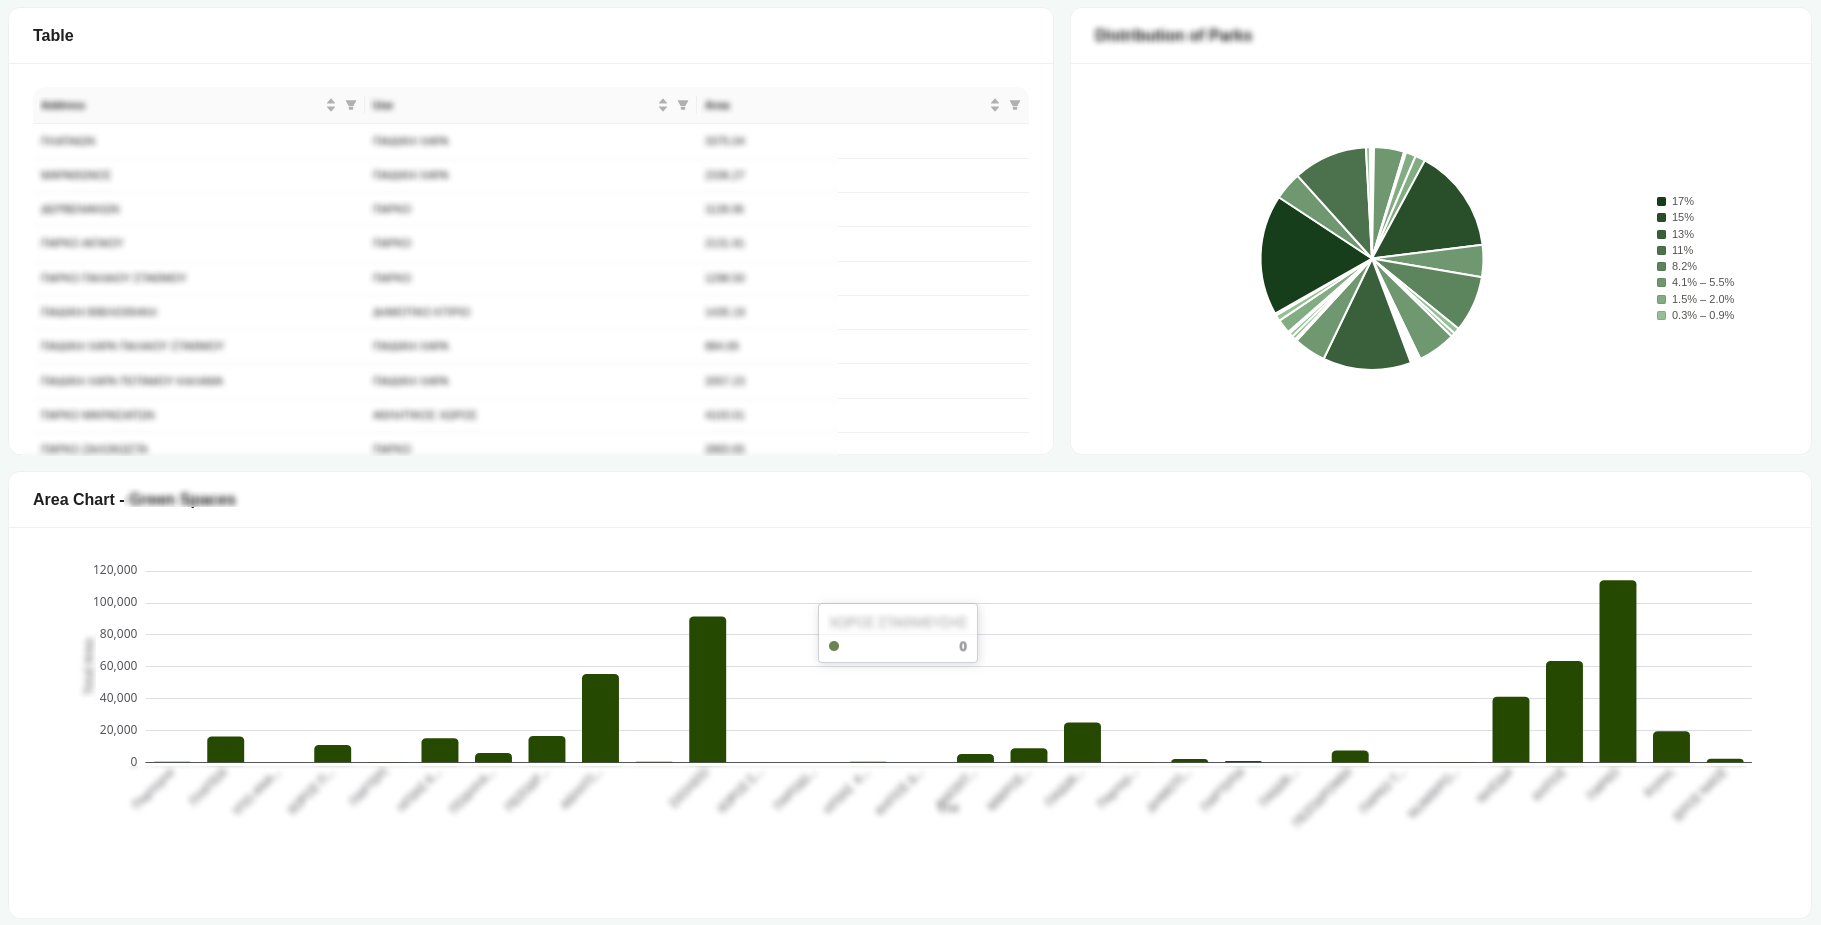
The standard dashboard presents your data through a collection of coordinated visual components, letting you take in an overview at a glance while drilling into specifics as needed:
- A sortable, filterable table lays out individual records row by row, so you can inspect exact values and narrow the view down to just what you're interested in.
- A pie chart breaks down how the total is distributed across categories, making proportions and relative shares easy to read.
- A bar chart compares magnitudes across groups so larger and smaller segments stand out immediately.
- A map component plots records geographically, giving spatial context to the underlying data.
- A counter block surfaces key aggregate figures at a glance, displaying the count, minimum, maximum, average, and sum of the selected data.
Together these pieces turn raw records into an interactive picture you can scan quickly or interrogate in detail.