Attribute Table
The Attribute Table is a resizable, draggable bottom panel that serves as the central hub for viewing and interacting with tabular feature data across the Map Viewer. It is organized into multiple tabs, each corresponding to a different data source or workflow.
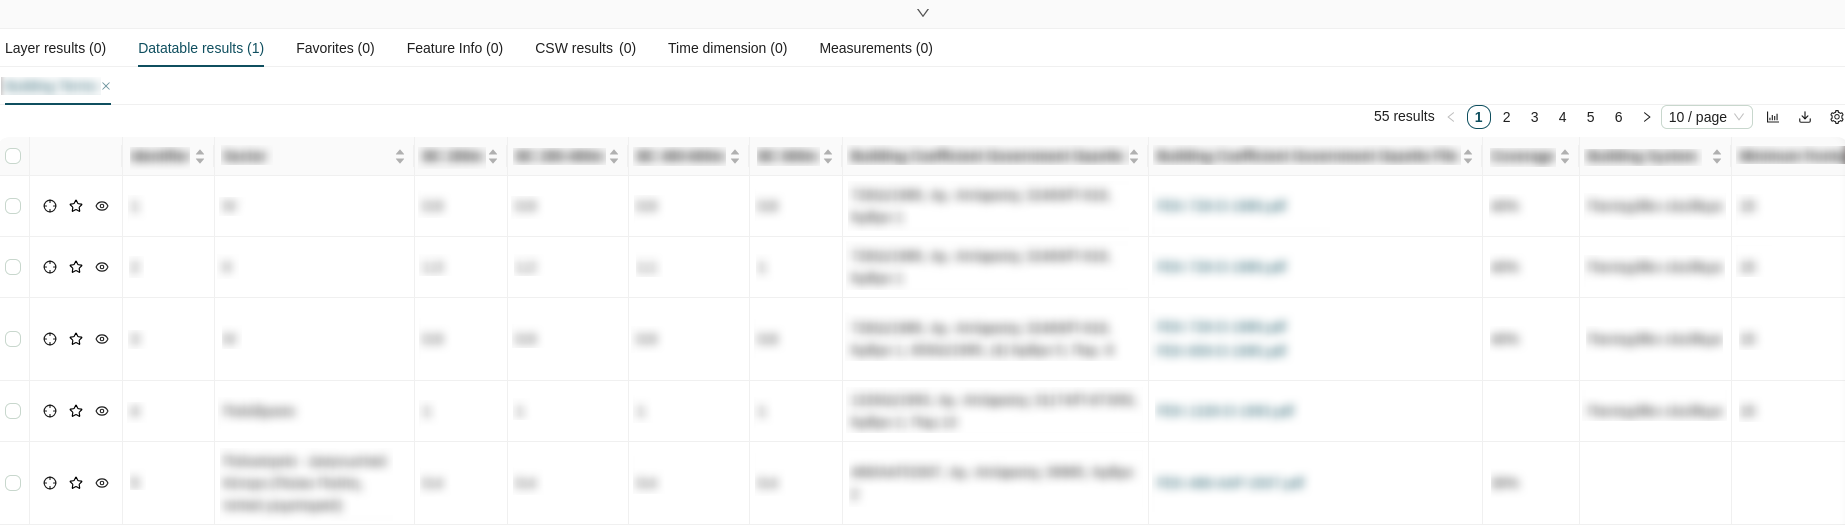
Table Format
All tabs within the Attribute Table share a consistent table layout:
Columns
- Checkbox Column: The first column provides a selectable checkbox for each row, allowing you to select one or multiple features simultaneously. Each row represents a feature from the corresponding map layer.
-
Actions Column: The second column contains three action buttons per row:
Icon Action Description 
Zoom to extent Zooms and pans the map canvas to the geographic location of the feature. 
Add to favorites Adds the feature to the Favorites tab for quick reference. 
View details Opens a modal window displaying the full feature details. -
Attribute Columns: The remaining columns display the feature's attribute fields. All attribute columns are sortable by clicking their header.
View Details Modal
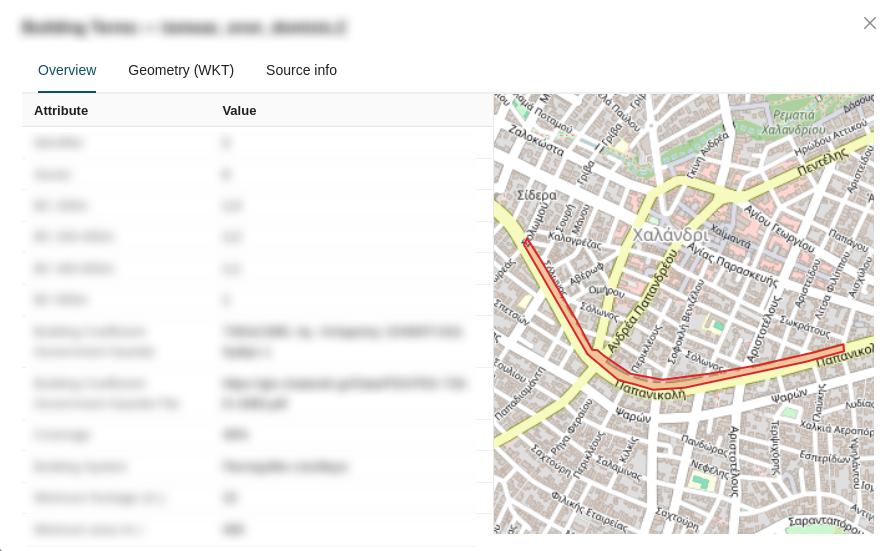
The View details modal provides an in-depth inspection of a single feature, organized into three tabs:
- Overview: Displays a focused map view centered on the feature alongside a table listing all associated attribute data.
-
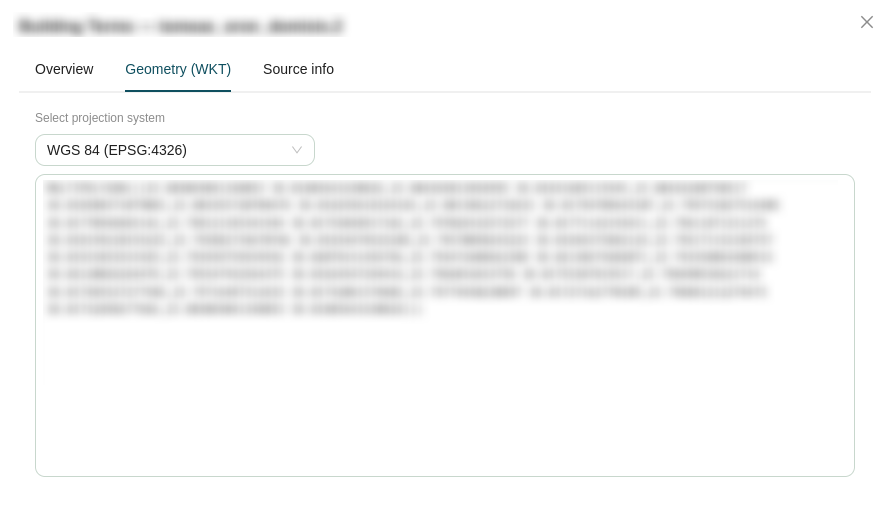
Geometry (WKT): Shows the feature's geometry in Well-Known Text format. A projection dropdown allows you to convert the geometry representation between supported coordinate systems:
Projection EPSG Code WGS 84 EPSG:4326Web Mercator EPSG:3857ΕΓΣΑ 87 EPSG:2100 -
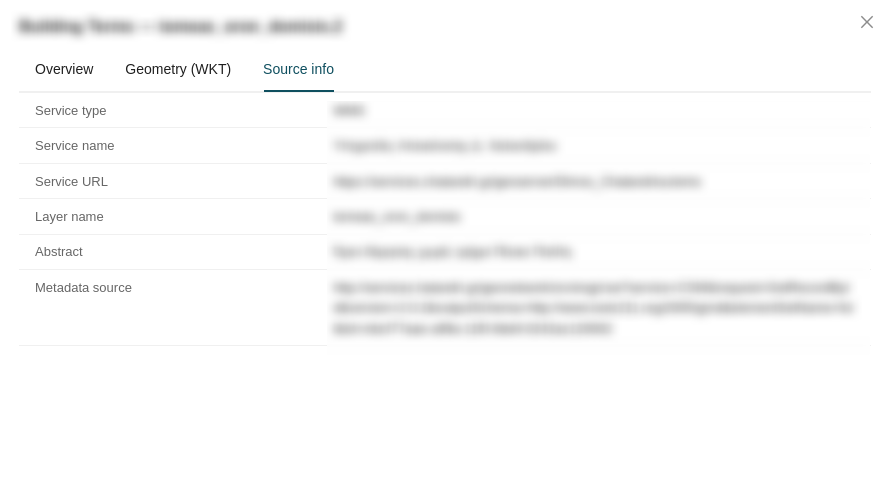
Source info: Displays metadata about the feature's originating data source.
Pagination and Controls
The top-right corner of the table provides controls for managing result display and export:
- Results Count: Displays the total number of matching features.
- Page Navigation: Shows the current page and total number of pages, with controls to navigate between them.
- Results Per Page: A dropdown to adjust how many rows are displayed per page (
10,20,50, or100). - Download: Click the download icon (
 ) to export the current table data as a GeoJSON file.
- Column Settings: Click the gear icon (
 ) to select which attribute columns are visible and reorder them within the table.

Tabs
The Attribute Table is divided into the following tabs, each populated by different tools and workflows throughout the Map Viewer:
| Tab | Data Source |
|---|---|
| Layer Results | Features returned by the Search sidebar panel and the Quick Search toolbar tool. |
| Datatable Results | Feature data opened via the Data table action in the Manage Layers panel. |
| Favorites | Features saved using the Add to favorites action from any table tab. |
| Feature Info | Attribute data retrieved via the Feature Info toolbar tool or the Location info option in the Right Click contextual menu. |
| CSW Search | Metadata records returned by the CSW Search sidebar panel. |
| Time Dimension | Temporal data from time-enabled WMS layers. |
| Measurements | A consolidated log of all measurements created with the Measure toolbar tool. |
Layer Results
The Layer Results tab displays features returned by the Search sidebar panel or the Quick Search toolbar tool. When a search is executed, matching features populate this tab and the map canvas is filtered to display only those results.
Datatable Results
The Datatable Results tab displays the full attribute dataset for a layer opened via the Data table action in the Manage Layers contextual menu.
Favorites
The Favorites tab serves as a personal collection of features saved from any other table tab using the Add to favorites row action. This allows you to aggregate features of interest from different layers and workflows into a single consolidated view.
Feature Info
The Feature Info tab displays attribute data retrieved by clicking on features using the Feature Info toolbar tool, or by selecting Location info from the Right Click contextual menu on the map canvas.
CSW Search Results
The CSW Search tab displays metadata records returned by queries executed from the CSW Search sidebar panel.
Time Dimension
The Time Dimension tab displays temporal data from WMS layers that have been configured with a time dimension, allowing you to inspect feature attributes across different points in time.
Info
This tab requires a temporal WMS layer to be active in your map session. Further documentation is forthcoming.
Measurements
The Measurements tab provides a consolidated log of all measurements created using the Measure Distance, Area and Angle toolbar tool. Each measurement entry records the geometry type, calculated value, and unit of measurement.